Social Indicators established by the United Nations Statistical Division include Child-bearing, Water supply and sanitation, Child and elderly populations, Contraceptive use, Literacy, Population, Unemployment, Education, Health, Income, economic activity, Housing and Human settlements (United Nations Statistical Division 2009). Of these social indicators, this paper shall review social data on the social indicator of Literacy in the United States. The reason for this selection is the fact that a nation’s educational standing plays an integral role in the development of the nation in the future and is an indicator that can have long term implications on the country.
In particular, the paper will look into social data on the trends in academic progress observed in children of nine to seventeen years of age. The data used for this particular purpose shall be obtained from the Whitehouse Social Statistics Briefing Room of the National Center for Education Statistics. The data was accumulated and compiled by the National Assessment of Educational Progress and has been used in this paper because of the fact that it was accumulated through the establishment of appropriate variables. For instance, when the data for this research was accumulated, a number of contextual variables were identified. These included homework, course taking patterns in mathematics, reading for fun and computer access and usage (NAEP 2004). The data accumulation process also made extensive use of percentiles to evaluate performance levels.
Social indicator data is of the utmost significance in light of the fact that it allows analysts to study the society’s behavioral trends and allows them to make use of retrospect to determine the fundamental variables that have influences on the progress of the society. One such social indicator is that of educational progress which can be observed as an indicator of the potential for development that a society holds (Hauser 2005). In this paper, two perimeters shall be shed light upon to acquire an understanding of the educational trends in the United States. However, it is essential to highlight that this analysis is by no means meant to be one that is supposed to facilitate in the development of a general understanding regarding educational standards in the US. Three specific age groups have been singled in the subject data set for analysis purposes. The establishment of these three data sets is meant to facilitate in the establishment of the perimeters of the research. It also contributes to the establishment of a boundary for the study.
The research for the data was performed on two perimeters. The first perimeter was that of the trends in the American children’s’ reading capabilities and how they had evolved over the last thirty years or so (Perie and Moran 2005). The second perimeter was that of the Trends in average mathematics scale scores and how they had evolved over the last thirty years or so. Around thirty eight thousand students participated in the assessments made for reading capabilities and around thirty seven thousand students participated in the assessments for mathematics capabilities.
General similarities between the perimeters included the fact that observations were taken at the ages of nine, thirteen and seventeen and were plotted out in the form of a line graph in order to show levels of development with respect to age group as well as with respect to the year. The score brackets in the line graphs were established at a minimum of two hundred and a maximum of three hundred and twenty.
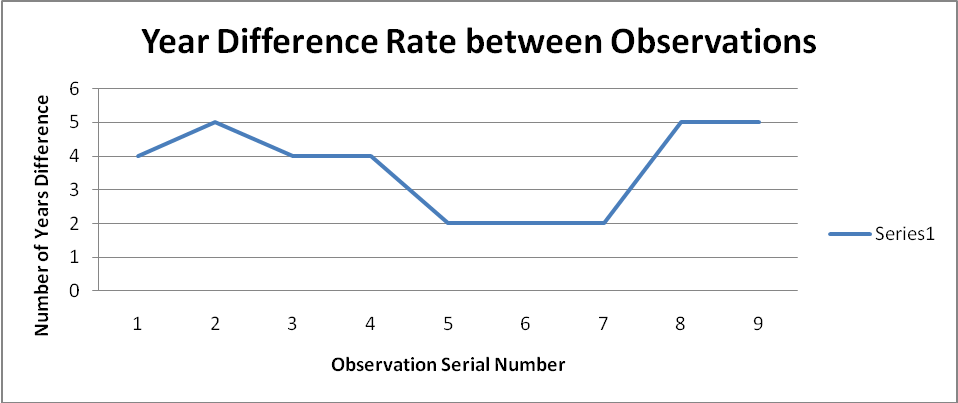
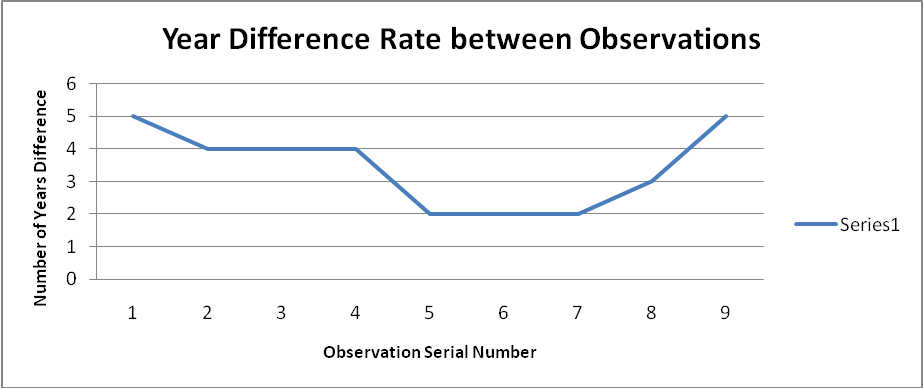
The observations taken were in a manner such that the distance between each year in which an observation was taken was carrying continuously (InfoUSA 2009). In the case of the observations taken for the Trends in average reading scale scores for students, the observations began from the year 1971 and continued to the year 2004. In the middle of these two brackets, the observations were taken in a manner such that the distance between the observation years continued to decrease rapidly until a certain level of distance was maintained at a certain point. This standard level was a difference of two years which continued from the year of 1988 to 1994.Following 1994 the difference between the observation years increased dramatically from two years to five years and continued to remain so for the proceeding observations. It is essential to highlight at this point that each observation data length spanned over thirty years. In the case of the observations made for Trends in average reading scale scores for students, the length of the study was a total of thirty three years during which ten observations were taken over a period of variable intervals. The trends in the interval between the years can be observed in table A.1 and A.2.
The observations taken for Trends in average reading scale scores for students were ones that followed a highly similar pattern but were ones that differed in terms of the initial readings and the final readings. While the observations for the Trends in average reading scale scores for students spanned a total of thirty three years, the observations made to study the Trends in average mathematics scale scores for students spanned a total of thirty one years, beginning from 1973 and concluding at 2004. Much like the observations for the Trends in average reading scale scores for students, the observations made to study the Trends in average mathematics scale scores for students were taken in a similar fashion with regard to the intervals between the years. For four three consecutive reading observations, the intervals between the observed years remained at two years. A better understanding of this difference can be acquired through observation of Table A.2.
In the case of trends in average reading scale scores for students of age seventeen, it was observed that while scale scores began at 285 in the year 1971, it rose to a maximum of 290 around the year 1990 but fell once more during the years 1994 and 2004 in particular. In the case of trends in average reading scale scores for students of age thirteen, the scale scores stood at 255 for the year 1971 and did not make any significant improvement at all. In fact, while the scale scores were observed to increase slowly but steadily for the next few years, they fell after 1992 and continued to fluctuate for the next few years until they were recorded at 259 in the year 2004.
Perhaps the one age group was that of the students of nine years of age. Observations showed that the scale score for trends in average reading scale scores for students of the age nine began from 208 in 1971 and stood at 219 in 2004. However, this improvement was one that was highly unprecedented and it would be unjustified to consider it as one that will remain consistently judging by the fact that there was a significant degree of fluctuation in the scale score. The scale score rose from 208 in 1971 to 215 in 1980 after which it began to fall and fell to 209 in 1990 after which a steady rate of growth maintained up to 1999 where the scale score reached 212. In 2004, the score jumped from 212 in 1999 to 219. It is for the same reason that further study in this regard is perhaps the only determinant that can assist in the establishment of whether or not the score will hold at an improved level.
In the case of the trends in average mathematics scale scores for students of the ages 9, 13, and 17, it was observed that the students showed a significant degree of improvement in all three age groups. Students of 9 years of age showed the most improvement since their extrapolated score began from 219 and remained at 219 for the next two years. This followed a period of drastic improvement in which the scale score jumped from 222 in 1986 to 230 in 1990. The level of the scale score remained same stable for the next four years, after which it jumped from 232 in 1999 to 241 in 2004.
Of all three age groups studied with regard to the trends in average mathematics scale scores, this was the one particular age group that experienced the most development. Following this age group was that of the students of thirteen years of age. It was observed that significant and strong improvements had been experienced in the students of thirteen years of age with respect to the trends in average mathematics scale scores. The study showed the extrapolated score of 266 in the year 1973 soon afterwards which a decrease was observed. It was noted that the students of this age group showed a steady rate of improvement with only one actual point at which the scale score deteriorated. The scale score showed an improvement in the year 1982 after which it remained steady for the next two to three years. Following 1990, a steady increase was observed which continued till the last observation made in 2004 at 281.
In the students of the age group of seventeen years of age, it was observed that the fluctuations in the trends in average mathematics scale scores ware of a somewhat precarious nature. The extrapolated scale score in 1973 was 304 which fell to 300 in 1978 and continued to fall until it reached 298 in1982. In 1986, the scale score showed signs of improvement and continued to improve up to 1992 where it reached 307. Following 1992, the scale score for seventeen year old students for trends in progress in mathematics continued to fluctuate between 305 and 308 until it was recorded at 307 in 2004.
If anything, the data was a clear indicator of the fact that there had hardly been any phenomenal improvements in the American education system and the system is in need of a dramatic change if any revolutionary or noticeable changes are to take place. It was also noticed that the levels had actually deteriorated at certain points in the last thirty years and there while there was evidence of stability, there was no evidence of a steady climb. Rather any improvement observed was observed to be have been negated by a steady deterioration of the academic level.
The continuous fluctuations in the data sets also serve to prove the need for continuous and extensive research in the two subject areas of the research. Another highly significant cause for concern is the fact that there are far too many fluctuations in the data for comfort. The data set appears to be one that is dwindling continuously and there are very few instances where the trends have entered a stable run. While positive trends may appear to be a reason for optimism, the fluctuations are far too frequent to allow one to consider the standing of the trends to be stable.
List of References
Perie, M., and Moran, R. (2005) NAEP 2004 Trends in Academic Progress: Three Decades of Student Performance in Reading and Mathematics. U.S. Department of Education, Institute of Education Sciences, National Center for Education Statistics. Washington, DC: Government Printing Office.
United Nations Statistical Division (2009) Social indicators. Web.
Hauser, R (2005) Measuring literacy. National Academies Press
NAEP (2004) Trends in Academic Progress: Three Decades of Student Performance in Reading and Math. Web.
InfoUSA (2004) Trends in Academic Progress. Web.