
Introduction
Digital technologies permeate all areas of modern life and change the way individuals behave. While the direct impact of technology is evident in the growing rate of automation across different industries, more subtle impacts are not always clearly identifiable. Procrastination has long been recognized as particularly relevant for student populations, mainly because (but not limited to) the associated negative impact on adolescents’ academic attitudes and performance (Alblwi et al., 2021).
However, the relatively small number of studies on the subject, with a focus on this population, provides a rationale for exploring the issue further. For example, there is a gap in research on the impact of digital technology use on procrastination levels among adolescents, making this topic relevant and important (Türel & Dokumacı, 2022). Considering the potential negative impact of procrastination on students’ academic performance and learning attitudes, this study aims to determine whether there is a correlation between these variables (Türel & Dokumacı, 2022). The research question is: Does the time students spend on social media affect their procrastination levels?
The study will explore three variables to answer this research question: students’ procrastination level, social media use rate, and the time they spend online. The first variable is the dependent one, while the other two are independent variables. The corresponding hypotheses are as follows:
- H10: The time spent online does not affect students’ procrastination levels.
- H11: The time spent online increases students’ procrastination levels.
- H20: Social media use levels do not affect students’ procrastination levels.
- H21: Social media use levels increase students’ procrastination levels.
Method
Design
The study employed a quantitative research method relying on a survey distributed electronically to the participants. In addition to general demographic data, the survey assessed the relevant variables through a Likert-type scale questionnaire. The method was chosen for its popularity and applicability in the fields of education and the social sciences, where researchers seek to collect quantitative data (Kusmaryono et al., 2022). The study uses two independent variables to explore the research question in several dimensions and potentially gain more comprehensive results.
Participants
The sample was drawn from students across several universities in Ireland. Since it was impossible to reliably identify the size of the population, participants were recruited based on voluntary completion of the survey. The initial round yielded 100 responses, including 14 first-year, 21 second-year, 40 third-year, 19 fourth-year, and six postgraduate students. The ages ranged from 18 to 25, with one respondent aged 40 and four respondents refusing to indicate their age. By gender, the sample comprised 72 females and 28 males. After the data screening and extraction process, three cases were excluded due to missing values or response invariance, leaving 97 relevant cases for analysis.
Materials
For data collection, a survey comprising three sections was used. The first section contained items on students’ demographic characteristics, including their age, gender, place of study, years of study, QCA, and self-reported average time spent online. The second section is the first part of the Likert-type 5-point scale questionnaire assessing the respondents’ attitudes toward social media use, including interpersonal and educational aspects. This section contains seven items divided into these aspects. The third section is the second part of the Likert-type 5-point scale questionnaire, consisting of 21 items and assessing the respondents’ self-reported general procrastination levels. The Cronbach’s alpha for the assembled Likert-scale questionnaire is 0.757, which is an acceptable reliability level (Kennedy, 2022). Table 1 contains the corresponding reliability statistics data calculated in SPSS.
Table 1 – Reliability statistics
Informed Consent and Other Ethical Considerations
All participants were informed of the survey’s purpose and method, as well as relevant confidentiality and privacy issues, in a supplemental letter distributed with the survey. Informed consent was collected from all participants submitting the responses as implied by their submission of the survey after reading the accompanying supplementary letter. No coercion or other inappropriate data collection methods were applied; all responses were collected through voluntary completion and submission of the survey.
Results
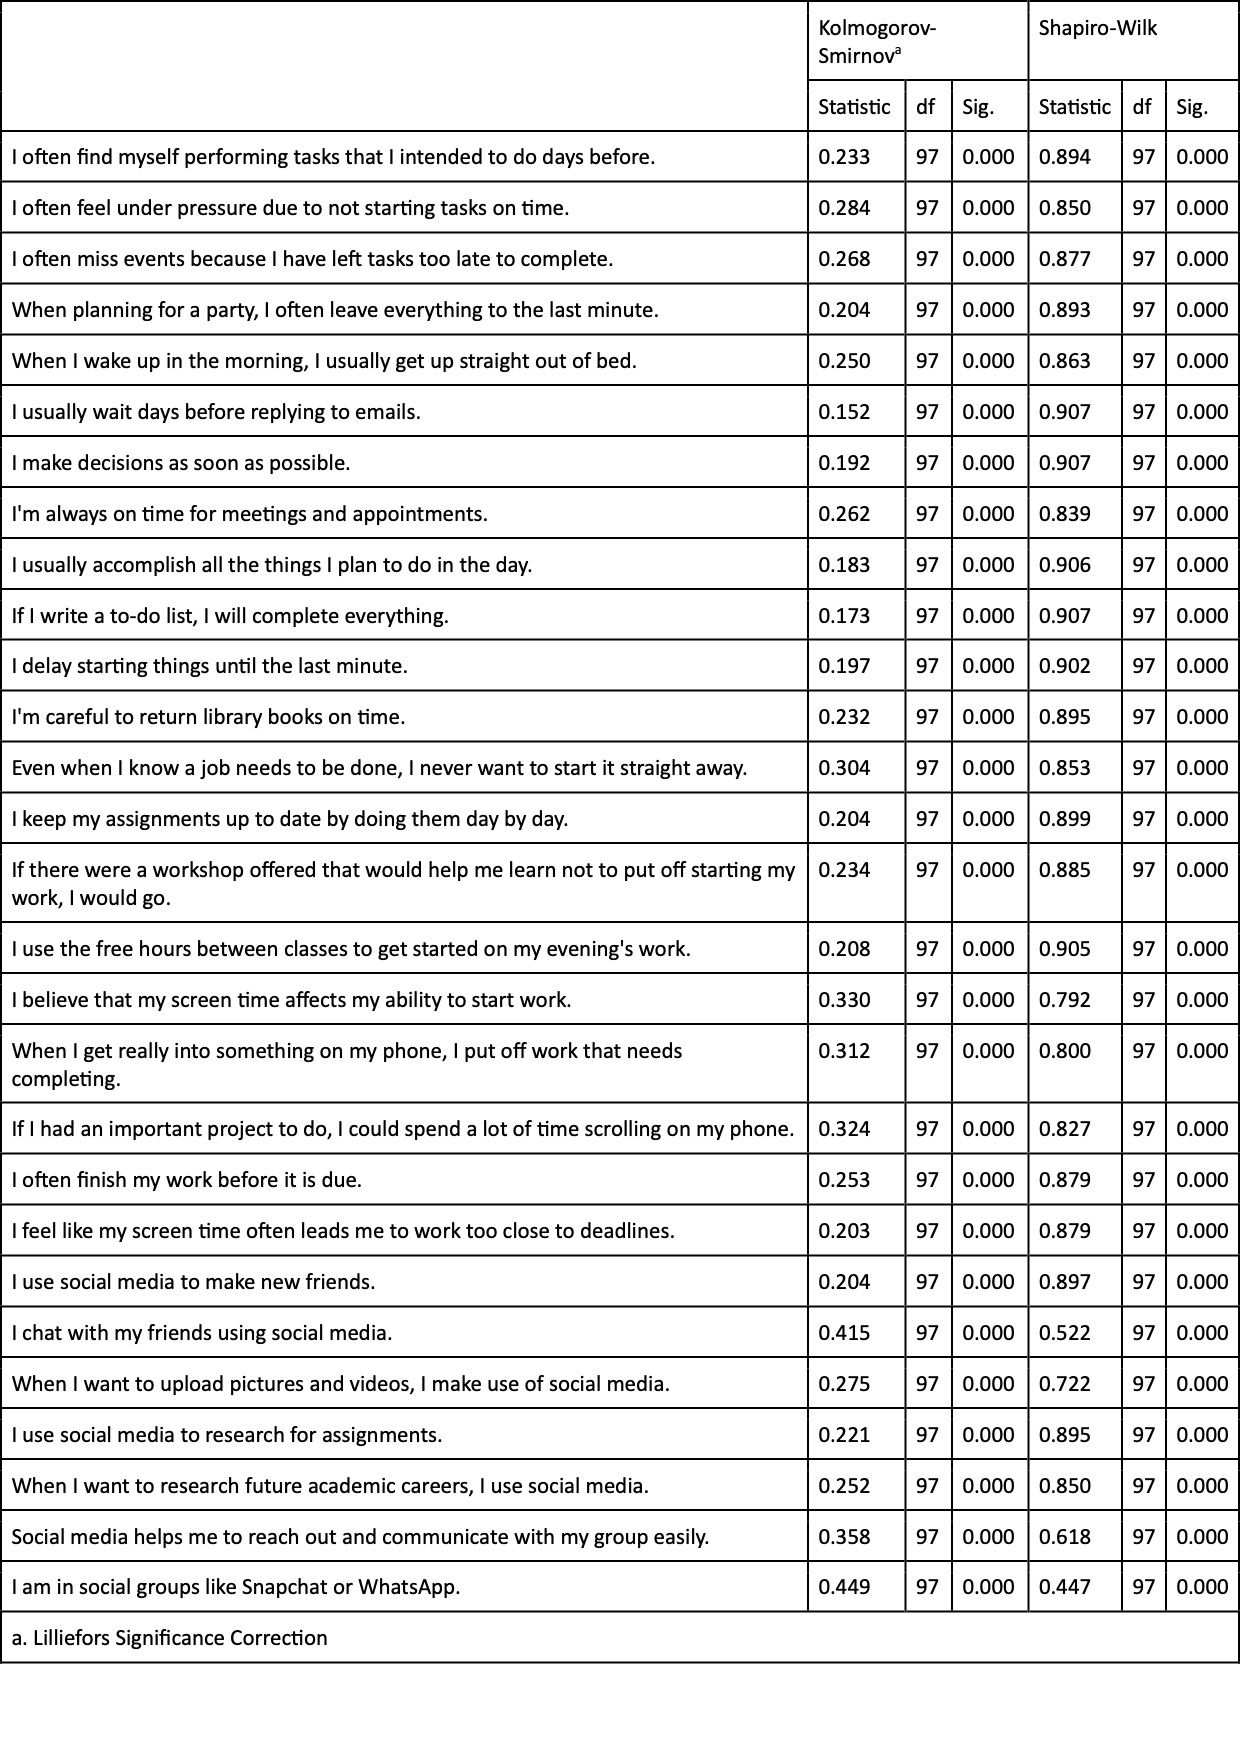
Data analysis was conducted using the IBM SPSS Statistics 27 software package. The linear regression analysis was applied to search for a correlation between the variables. The response data from the questionnaire were tested for normality. The results of the Kolmogorov-Smirnov and Shapiro-Wilks tests showed significance levels below 0.001 for all items, suggesting that the data were not normally distributed (Khatun, 2021) (Table 2). The data were also tested for linearity, with the assumption confirmed by analysis of the scatter plots (Figures 1 and 2).
Table 2 – Kolmogorov-Smirnov and Shapiro-Wilks Normality Test Results
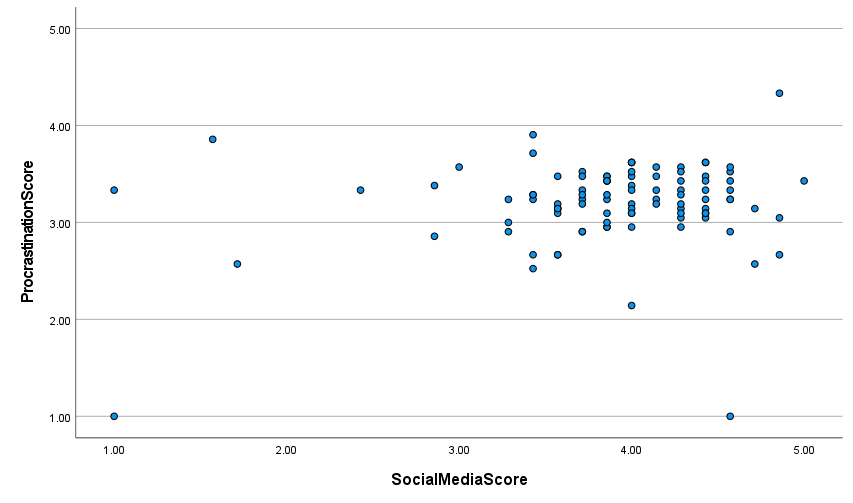
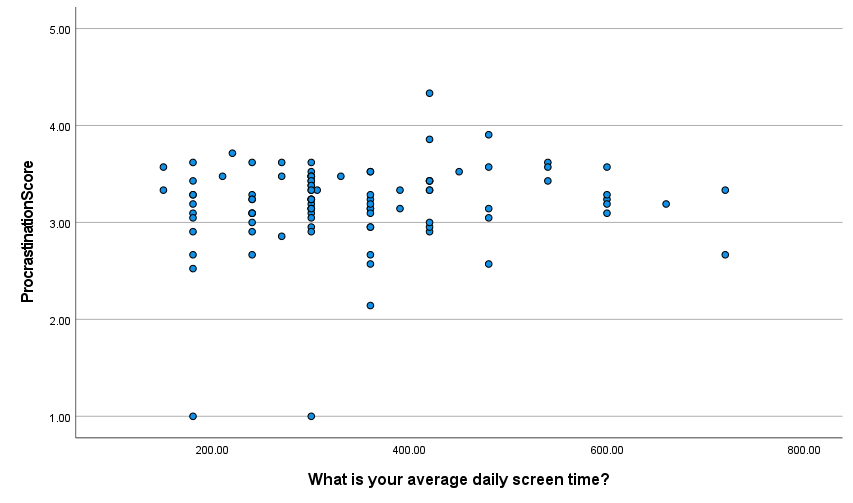
The data was tested for homoscedasticity to ensure that the variance in the data across different values of the measured variables is the same. Figure 3 shows the result, suggesting a mild violation of this assumption. The Breusch-Pagan test was then applied, with the significance level of 0.245 > 0.05, suggesting the presence of homoscedasticity (Table 3) (Abdul-Hameed & Matanmi, 2021).
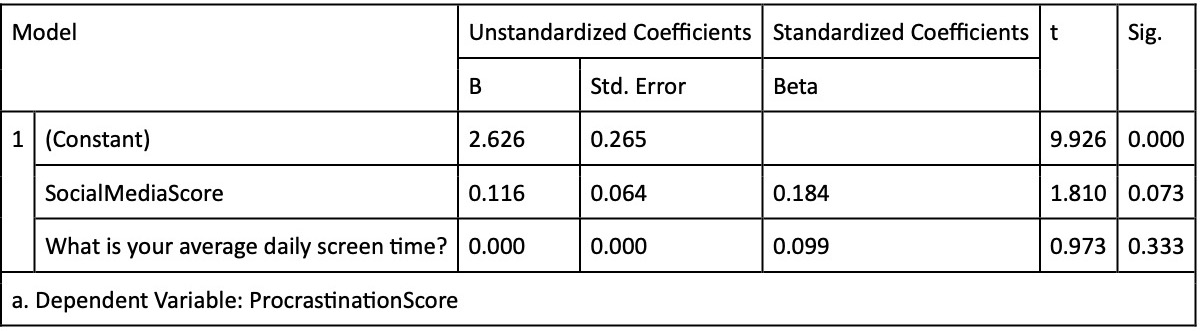
The Chi-square test of independence was conducted, indicating that there is no association between average screen time and procrastination level scores. At the same time, the latter is associated with social media use level scores (Table 4) (Turhan, 2020). Therefore, the independence assumption is violated for at least one independent variable. Linear correlation analysis was applied. The descriptive statistics and the correlation data are presented in Tables 5 and 6, respectively. The coefficients obtained during the analysis are also provided in Table 7.
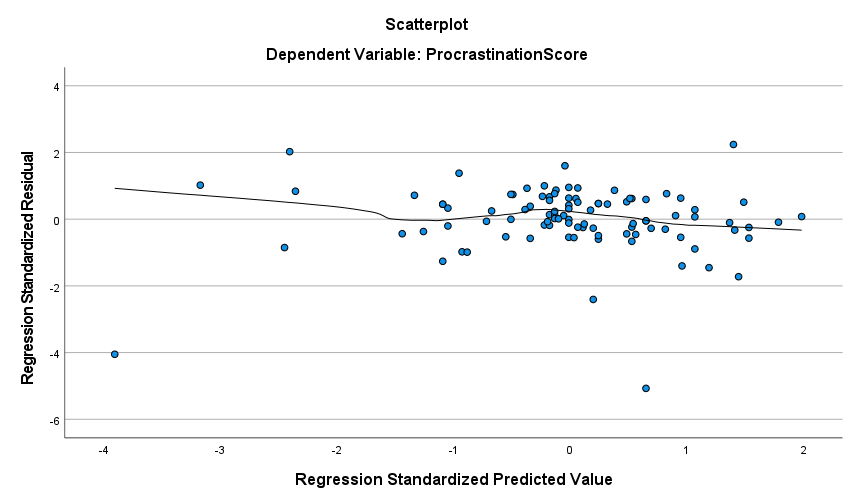
Table 3 – Breusch-Pagan Test Results
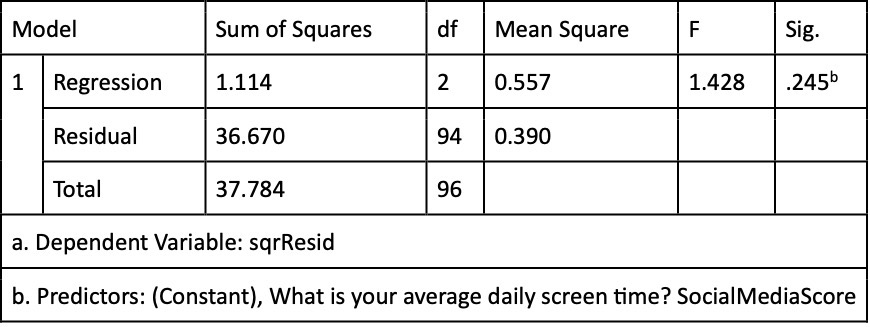
Table 4 – Chi-square test results
Table 5 – Descriptive statistics
Table 6 – Correlations
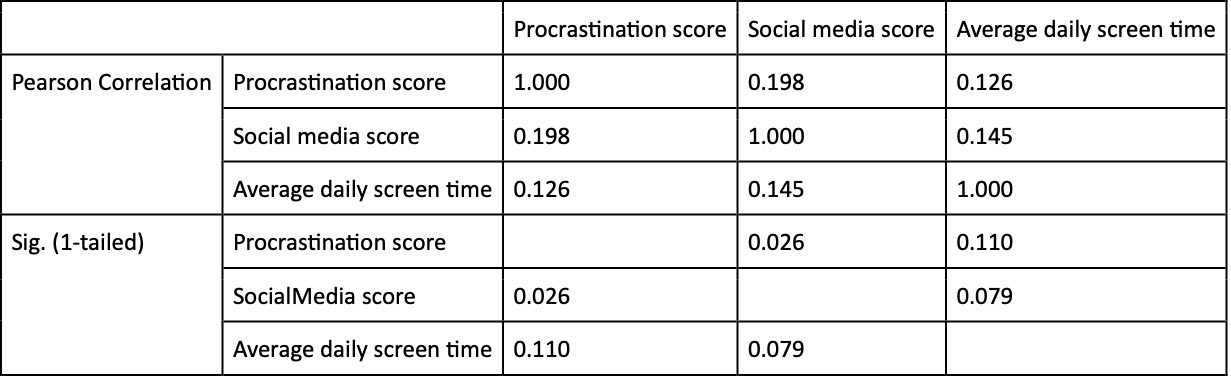
Table 7 – Linear regression coefficients
Relevant assumptions (normality, linearity, homoscedasticity, and independence) were tested to ensure that the data are suitable for the chosen analysis method. Though the normality assumption was violated, as indicated by the data from Table 2, the chosen analytical approach is sufficiently robust to such violations, with the associated risks being limited and manageable (Knief & Forstmeier, 2021). Similarly, the independence assumption was violated for one of the relations between average screen time and procrastination-level scores. The violation of this particular assumption is considered to be the riskiest because of the associated danger of inflated confidence and statistical significance levels, potentially introducing type I errors (Knief & Forstmeier, 2021). However, this particular association did not show a statistically significant result, so the violation can be accepted in retrospect.
Discussion
The present study was conducted to investigate the association between Irish students’ use of social media and their tendency to procrastinate. The decisions regarding the hypotheses’ acceptance or rejection are provided in Table 8.
Table 8 – Statuses of Hypotheses
The first set of hypotheses addressed the relationship between the time students spend online and their levels of procrastination. The correlation data in Table 6 shows that the analysis did not show a statistically significant correlation between the two variables, so H10 was accepted, and H11 was rejected. This result contradicts some of the prior studies that showed that there is a relation between prolonged use and decreased productivity caused by procrastination (Elhai et al., 2021). This discrepancy could be explained by other factors impacting students’ performance, regardless of screen time. For example, Elhai et al. (2021) suggest that poor time management and neglect of important daily activities are more strongly associated with procrastination patterns than screen time.
The second set of hypotheses implied the technology habit approach, which recognizes the complexity and the multitude of ways that students can engage with digital technologies. Therefore, H20 and H21 aimed to determine whether social media use levels affect students’ procrastination. The data from Table 6 suggests a statistically significant correlation between the variables. However, it does not align with the corresponding p-value of 0.073 in Table 7, implying that it is not possible to reliably assess the strength of the observed correlation. Therefore, H20 can be rejected, and H21 can be accepted.
The study’s limitation is its narrow focus on only two independent variables. As Meier (2022) argues, the screen-time approach selected for this study is increasingly criticized as inadequate and lacking in depth. The authors tried to avoid this issue by introducing a more comprehensive variable (social media use levels). However, they failed to fully compensate, which could be explained by the low and irregular number of items in the questionnaire sections. Therefore, while the approach has shown good potential, future studies could benefit from improving the questionnaire’s structure by adding more items and focusing more on the technology-habit approach.
References
Abdul-Hameed, A. B., & Matanmi, O. G. (2021). A modified Breusch–Pagan test for detecting heteroskedasticity in the presence of outliers. Pure and Applied Mathematics Journal, 10(6), 139-149.
Alblwi, A., McAlaney, J., Al Thani, D. A. S., Phalp, K., & Ali, R. (2021). Procrastination on social media: predictors of types, triggers and acceptance of countermeasures. Social Network Analysis and Mining, 11(1), 19-37.
Elhai, J. D., Sapci, O., Yang, H., Amialchuk, A., Rozgonjuk, D., & Montag, C. (2021). Objectively‐measured and self‐reported smartphone use in relation to surface learning, procrastination, academic productivity, and psychopathology symptoms in college students. Human Behavior and Emerging Technologies, 3(5), 912-921.
Kennedy, I. (2022). Sample size determination in test-retest and Cronbach alpha reliability estimates. British Journal of Contemporary Education, 2(1), 17-29.
Khatun, N. (2021). Applications of normality test in statistical analysis. Open Journal of Statistics, 11(01), 113-123.
Knief, U., & Forstmeier, W. (2021). Violating the normality assumption may be the lesser of two evils. Behavior Research Methods, 53(6), 2576-2590.
Kusmaryono, I., Wijayanti, D., & Maharani, H. R. (2022). Number of Response Options, Reliability, Validity, and Potential Bias in the Use of the Likert Scale Education and Social Science Research: A Literature Review. International Journal of Educational Methodology, 8(4), 625-637.
Meier, A. (2022). Studying problems, not problematic usage: Do mobile checking habits increase procrastination and decrease well-being?. Mobile Media & Communication, 10(2), 272-293.
Türel, Y. K., & Dokumacı, O. (2022). Use of media and technology, academic procrastination, and academic achievement in adolescence. Participatory Educational Research, 9(2), 481-497.
Turhan, N. S. (2020). Karl Pearson’s chi-square tests. Educational Research and Reviews, 16(9), 575-580.