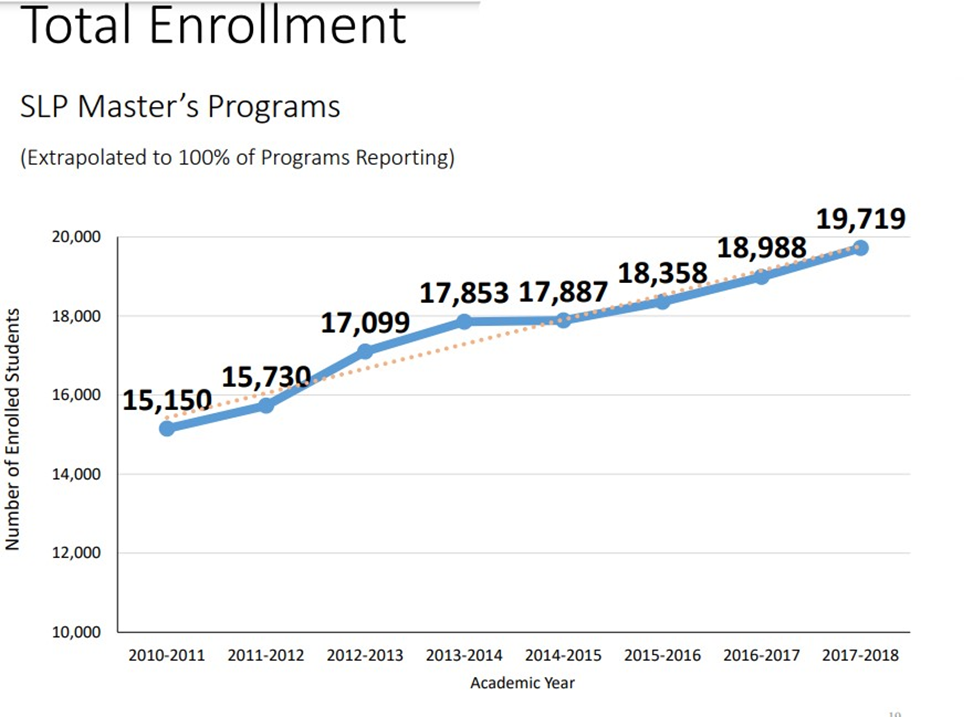
The present chart displays the total enrollment in Speech-Language Pathology (SLP) master’s programs in the United States for the years from 2010 to 2018. The chart was compiled by the American Speech-Language-Hearing Association (ASHA) together with the Council of Academic Programs in Communication Sciences and Disorders (CAPCSD). It constitutes a part of the Communication Sciences and Disorders Education Survey National Aggregate Data Report published in 2019.
According to the chart, the number of students enrolled in SLP master’s programs has been growing progressively since 2010. Over the last five years, from 2013 to 2018, the number of enrolled students has grown from 17,853 to 19,719, with the most significant growth rate reported in the last year (from 18,988 to 19,719) (American Speech-Language-Hearing Association, 2019). The chart provides no additional information on the reasons behind the trend and is designed to visually present the quantitative data.
Based on the analysis of the visual, it can be concluded that the popularity of SLP education is gradually increasing. According to the ASHA, one of the main reasons behind the growth is the increasing number of job opportunities for speech-language pathologists in school-based, bilingual, private-practice, and corporate settings (Market trends, n.d.). As the population grows older, there are expected to be more instances of health conditions that cause speech or language impairments, such as stroke or dementia, and where speech-language pathologists are required (Market trends, n.d.). The number of available jobs is expected to grow by 25 percent from 2019 to 2029 (Market trends, n.d.). Based on this tendency and the visual data, it can be predicted that the total enrollment in SLP master’s programs will also continue to grow.
References
American Speech-Language-Hearing Association. (2019). Total enrollment. SLP master’s programs [Chart]. Web.
Market trends. (n.d.). American Speech-Language-Hearing Association. Web.