Introduction
A certain university wanted to offer a special child education program for its scalars. The institute has over 100 scholars who want to take the course. The purpose of the study is for the university to introduce such a program to help scholars have the capacity of producing spirited participants in helping special children. The university then conducted a research on the demographic information of participants in the area who would be tested.
During the previous year, they have been testing the program with a small group of scholars and have seen dramatic progression with most of the learners performing very well. The program offers scholars with access to assistive child understanding systems along with training teachers for classroom teachings.
The university has seen quantifiable victory and is now seeking and focusing to expand their program to address the requirements of all the children with disabilities in the State.
Background of the study
In the contemporary development of our society, the idea of personnel training has been universally agreed as a basic factor in determining the employee performance hence the productivity within an organization. This has led to evolution of diverse training programs from on-job to off-job training.
Training to work with special education children may be attributed to the level of motivation for the teachers and partly the type of training. It is also common that some institutions especially those that experience low rates of performance do not offer training to employees at all, and if they do, they provide low quality training to their employees. Some institutions despite the importance of training as an indicator of productivity do not consider or value it at all.
Training provides workers with specific knowledge and skills in order to enable them perform specific tasks with much ease. It is short term educational process which utilizes systematic and organized procedures for learning technical knowledge. Special education development training enables one to be capable of educating the special people and know their needs. The society has realized that trained workers make economical and better use of their knowledge and equipment while serving others and less supervision is required.
Every human being tends to elevate his/her level of lack of skill. A nonprofessional may be as competent as a paraprofessional but may not be competent as a professional because different positions require different skills. A prospective capacity can be attained through self-evaluation followed by self-development. Self progress requires the longing to improve wisdom for selecting appropriate action and time needed for improvement. The desire must come from within the wisdom.
Statement of the problem
Many organizations tend to fail in getting competent special workers simply because of the organizations’ failure to go to greater lengths of training and testing of personnel improvement. It is this training that enables the participants to get equipped with the necessary skills they need to perform the tasks they are required of in the best possible and effective manner in a much more efficient way.
Objectives of the study
Main objective
The main objective of this study was to assess the effect of training employees to work with special education children and test their improvement in knowledge after completing a training program.
Specific objectives
The specific objectives of this study were:
- To find out the measure of participant confidence in knowledge achieved.
- To find out the challenges faced in the training of employees.
- To find out ways in which the training of employees based on their ages and gender can harness quality.
Frequency tables and bar charts for the nominal variables
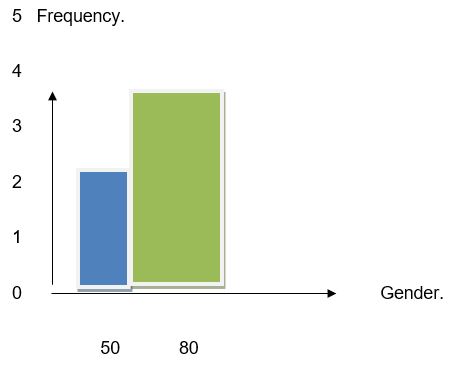
- Gender
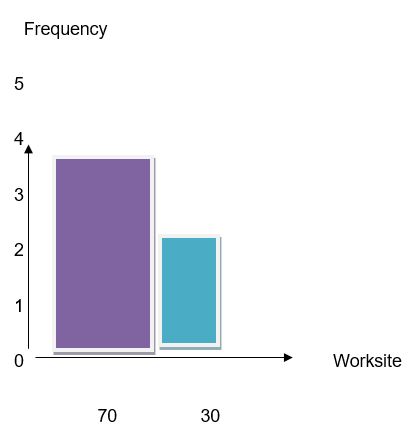
- Worksite
Figure 3. Frequency Table Showing Worksite
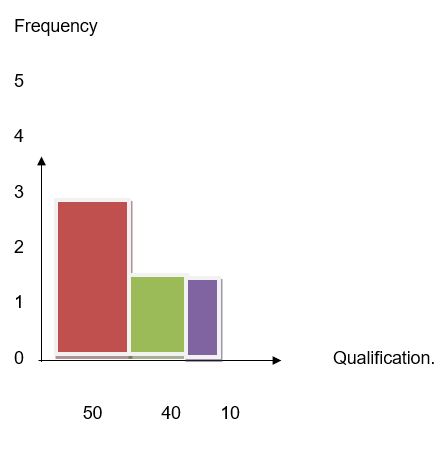
- Qualification
Descriptive statistics of central tendency, variability, skewness, and kurtosis for the continuous (scale) variables.
Figure 7. A Table of values consisting of central tendency
- Mean
This is given by ∑fx÷∑f as calculated below.
260÷8=32.5
- Mode
This refers to the age which is shared by majority and in our case it is 30.
- Median
In order to get the median, the items are first arranged in ascending or descending order of magnitude and their corresponding frequencies are written against them. The frequencies are cumulated and then the value of the middle item is located as shown below;
Figure 8. Median Calculation Table.
Median= ((n+1) ÷2) Th item.
= (8+1) ÷2
=9÷2
=4.5 Th item.
4.5 The item lies in 5 cumulative frequencies so: Median =30.
- Variability
In order to get variance, the standard deviation (S) must be obtained first in our case whereby;
S=√∑(x-m) ²
n -1
m refers to mean. Therefore,
Figure 9. Variability Calculation Table.
S= 218.75/(8-1)=31.25
The variance (S²) is obtained by squiring the standard deviation. Hence;
S²= 31.25²
=976.56
- Skewness (Sk)
This measures the symmetry of distribution expressed in terms of whatever difference there is between the mean and the median or between the mean and the mode. The mean will be equal to both median and mode if the distribution is perfectly symmetrical.
Sk=mean-mode/S=32.5-30/31.25=0.08, this is positively skewed.
- Kurtosis
In statistics, kurtosis refers to the degree of flatness or peakedness of a frequency curve and helps to find out how a particular distribution conforms to the normal curve. It shows the extent to which the curve is more flat topped than the normal curve.
Frequency tables and histograms with the normal curve superimposed for each scale variable
Figure 10. Frequency Tables of Participants
According to Karl Pearson’s Coefficient of Correlation Method.
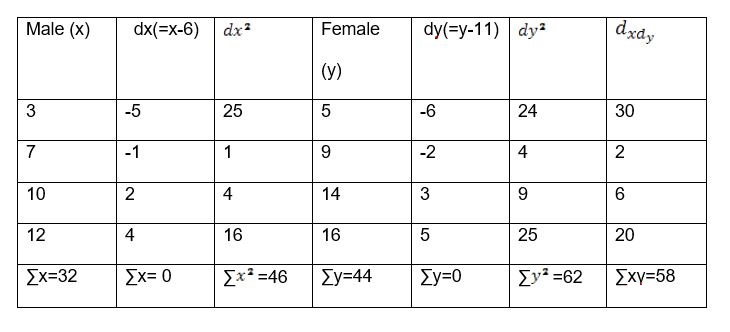
Correlation= =
=![]() =1.0861
=1.0861
The above correlation is a perfect positive correlation between the variables.
The closer the correlation is closer to +1 or the closer it is to -1, the stronger and closer the relationship between the two variables. And the closer the coefficient is to 0, the less close the relationship is. While beyond this it’s not safe to go.
Is a personnel training effective in improving their performance?
Before training.
Figures 12. Tables showing participants before Training.
After training
Figures 13. Tables showing participants after Training
- There is a significant increase in knowledge as a result of the training. This is because it is evidently seen that after training their performance is a bit higher as compared to when they were not yet trained.
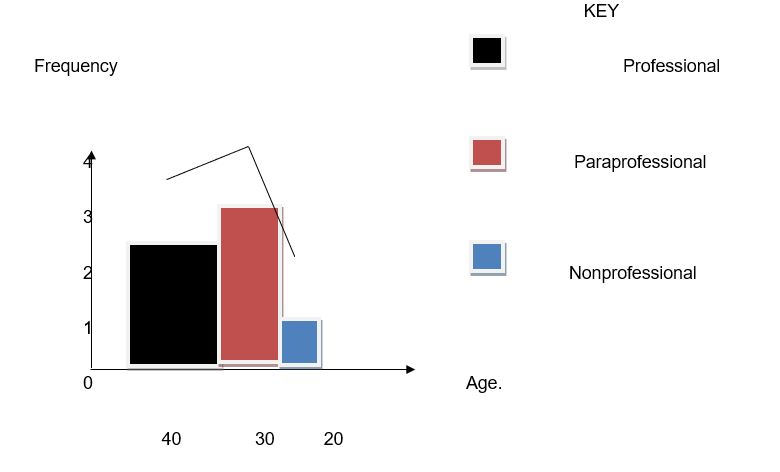
- The participants of different classification perform differently on the certification exam as seen from the above tables. Among the three groups, the professional group performs best and this could be because they have a higher working experience and they get to understand some of these things much better.
- After controlling for prior knowledge, there is a difference between professionals, paraprofessionals, and non-professionals in knowledge after the training. The professionals have more knowledge, paraprofessionals have medium knowledge and non-professionals have the least knowledge. This is because the paraprofessionals and non-professionals are less experienced as compared to professionals.
- Age predicts performance on the certification exam because the older the person the more experienced he is and the more knowledge he has hence better performance on the certification exam as seen from the above tables.
- In addition to age, other variables like years of experience and confidence improve the ability to predict performance on the certification exam. The more the experience years of a participant, the better the performance on the certification exam and the more confident a participant is, the better the performance and vice versa.
Findings
- After my research I found that the more experienced, aged and confident the participants are, the better their performance on the certification exam.
- Another finding is that men and women are equally effective in their performance.
Interpretation of the findings
- From the first finding above, it is because the participants have theoretically learned them in class and practically done them in the field for many years.
- For the second finding, it is because as evidenced in the correlation which is positive, an increase in performance of men leads to a subsequent increase in the performance of women.
Effectiveness of the training program in improving knowledge
The training program will enable the organization to introduce measures to deal with challenges in a humane and logic manner. The study will help the organization get to know ways and means to harness their knowledge through the use of equipping the employees with the necessary skills and expertise they require.
The above study indicates that training is an important factor for improving performance as a whole. Training should be systematic in that it is specifically designed, planned and implemented to meet defined needs. It will enable the organization to know the most effective methods that they can adopt to train their employees to ensure that they perform to the best of their capability.