A school’s web page is a vital resource for students, parents, and other stakeholders. It helps them find any necessary information they want about the school or read the institution’s news and updates. One of the best ways to display information, such as a calendar of events, class schedules, and available academic programs, is the use of tables. For the case of a school website, using tables to present information has many advantages. For example, multiple data can be compressed in the form of a table, making them an excellent way to display information (Bavdekar, 2015). Also, for the person viewing the website, it becomes easier for them to make comparisons on various aspects in question.
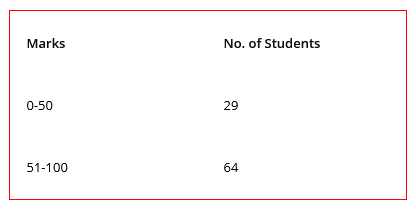
The above table makes it easier for the viewer to have a general impression of how students in that school have performed, and it is possible to determine the total number of students in that class. Therefore, the use of tables makes it easier to perform quantitative classification of a given set of data and compare a given variable’s shared characteristics.
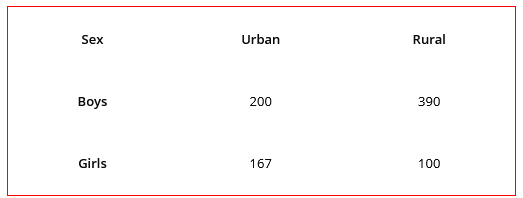
The table above is a qualitative analysis of a school’s population to enable the school to make informed decisions about students’ governing and support policies. Additionally, presenting the quantitative aspect of the school’s population, tabulating this information makes it possible to make comparisons between various traits displayed by specific students (Bavdekar, 2015). For example, the neighborhood a student comes from significantly affects their social and emotional behavior. In this case, tables enable the viewer to determine the absence or presence of specific school populations’ attributes. Therefore, the best way to present school data that cannot be quantified on a school website is through tables.
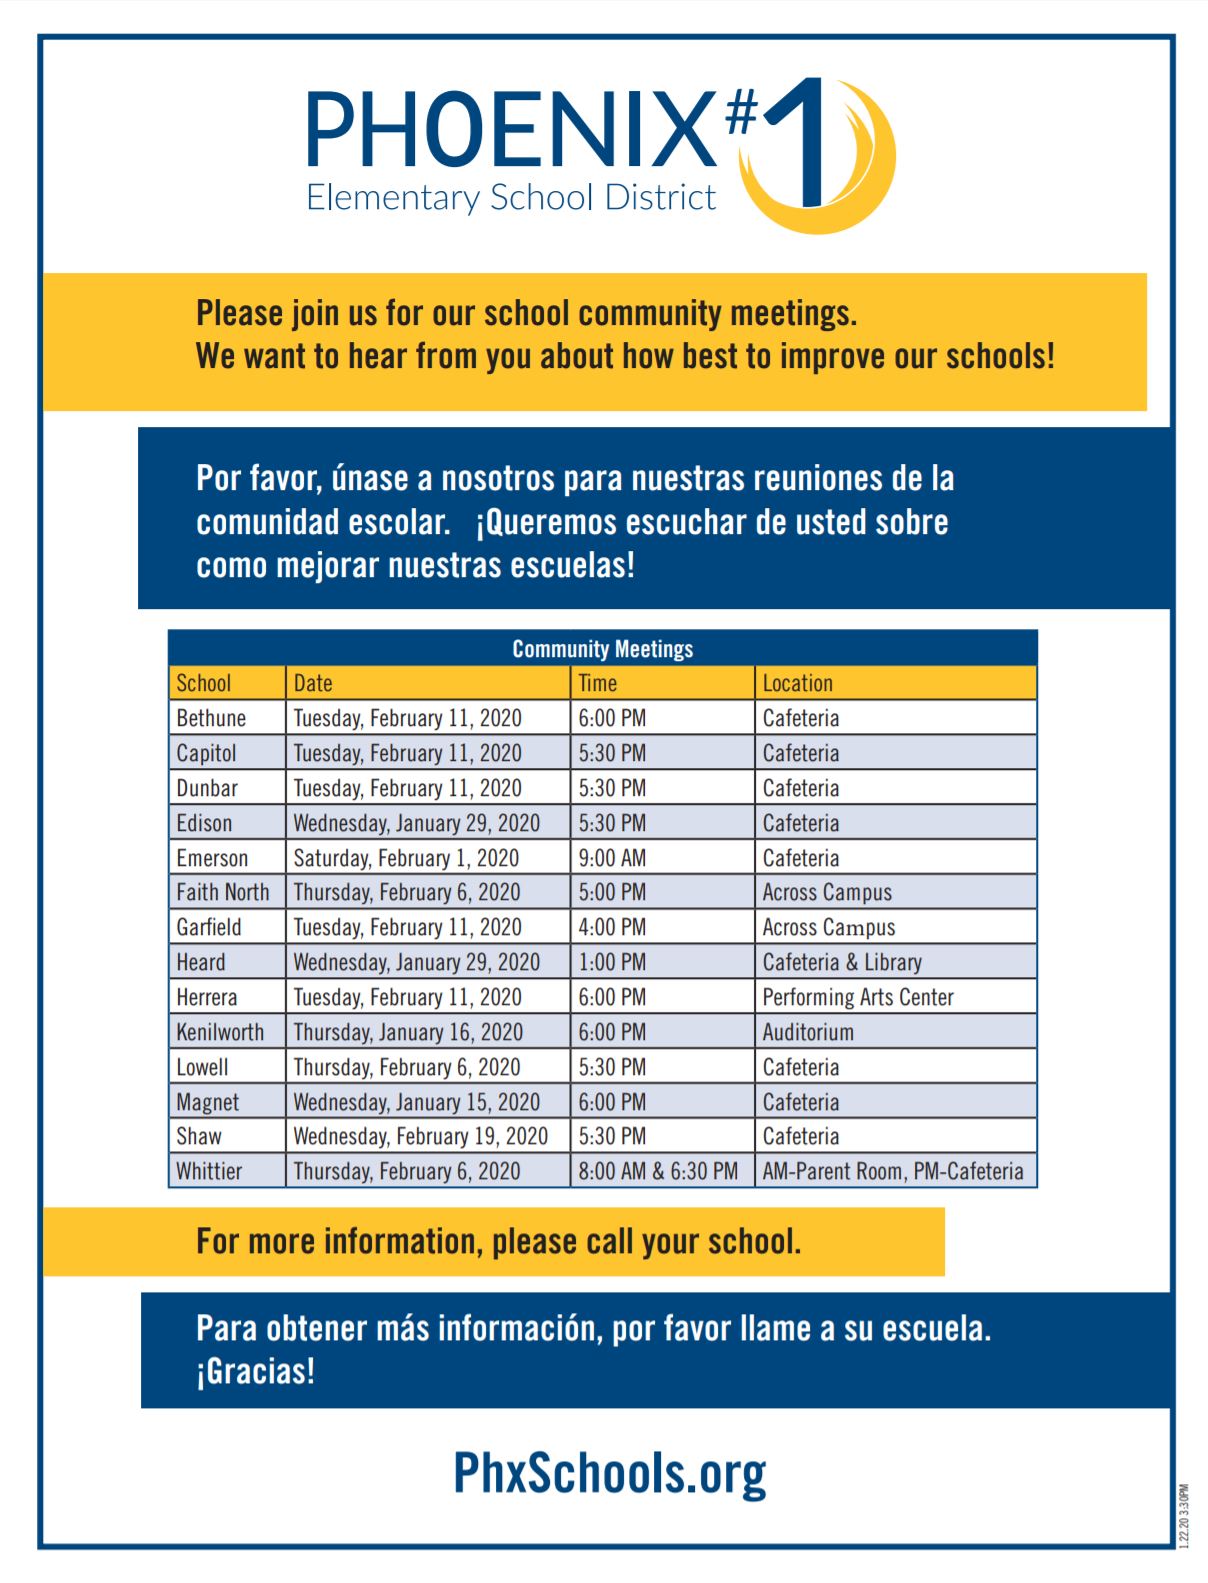
The figure above summarizes a school’s calendar of events, showing information for various community meetings; date, time, and venue. Tables help enhance the ease of presenting bulk information. If this information were displayed in the form of text, it would be difficult for a viewer to obtain information concerning these meetings. Therefore, this table is a compelling visual on a school’s website.
Reference
Bavdekar S. B. (2015). Using Tables and Graphs for Reporting Data. The Journal of the Association of Physicians of India, 63(10), 59–63.